《1. Introduction》
1. Introduction
Haff disease (HD) is an unexplained syndrome of myalgia and rhabdomyolysis occurring within 24 h after the consumption of cooked seafood [1]. HD was first discovered near the Baltic Sea in 1924, and the number of patients has increased with an upward trend [2]. Recently, this disease has spread in an increasing number of countries and regions, including Japan [3] and China [4]. In general, the consumption of boiled seafood, such as crayfish, is the primary cause of HD [5]. More specifically, the accepted view of the cause of HD is that an unidentified heat-stable toxin targets the transverse muscle upon entering the body, resulting in rhabdomyolysis, which is accompanied by the release of creatine kinase (CK) and other muscle cell enzymes. However, after more than 70 years of investigation and research, we still know very little about the pathogenic mechanism or etiology of HD. Given the gradual spread of the disease and the difficulty of preventing and monitoring it, there is a need to explore its potential molecular mechanisms for the future diagnosis and treatment of HD.
The common symptoms in HD patients are myalgia and rhabdomyolysis, and HD’s clinical manifestations include abnormal renal function, multi-organ failure, and prolonged myopathy [6]. Many studies have reported the vital role of protein glycosylation in the pathogenesis of muscle diseases [7]. In addition, organ damage is associated with glycosylation changes, and abnormal glycan structures in the circulation can be detected and serve as a biomarker for disease monitoring [8]. Indeed, the glycan composition also affects kidney function in health and disease [9], although the relationship between alterations in glycosylation and the development of HD is unknown. Understanding the glycosylation change that occurs in HD can reveal the potential molecular mechanisms of disease and mine possible disease markers.
Glycosylation of total serum glycoproteins was found to be strongly associated with inflammatory response and disease progression, revealing the potential value of N-glycans for disease stratification [10]. Significantly, further characterization of the glycome profile of a target glycoprotein can improve diagnostic performance and increase our understanding of the fundamental roles played by glycoconjugates in nearly all aspects of physiology and pathophysiology [11–13]. Given that HD is likely to be an acute disease caused by food toxins [14], we speculated that it is associated with the immune regulatory response in this disease development. Hence, the full immunological profile was characterized, including two complement components (C3 and C4) and three principal immunoglobulins (IgG, IgA, and IgM). It is notable that IgG possesses the ability to neutralize pathogens or toxins [15]. In addition, as the most abundant glycoprotein in the serum, IgG is involved in the body’s adaptive immune response and immune regulation [16]. IgG glycosylation is involved in the modulation of the inflammatory response and is strongly correlated with disease progression [17]. An in-depth mapping of the IgG glycome in HD would reveal the immunological profile of this rare disease, providing a new clue to the underlying molecular mechanism.
In fact, IgG has four subclasses—IgG1, IgG2, IgG3, and IgG4— each of which has a unique profile and different effector functions. IgG1 demonstrates the highest affinity for all Fc receptors (FcRs) and is a potent activator of antibody-dependent cellular cytotoxicity (ADCC) and antibody-dependent cellular phagocytosis (ADCP) [18]. IgG2 has a high affinity for the H131 form of FcRIIA but weak affinity for other FcRs. IgG2 plays an important role in the defense against certain bacterial infections [19]. Being a potent proinflammatory antibody, IgG3 demonstrates a high affinity for most FcRs and may restrict excessive inflammatory responses due to its shorter half-life. IgG4 only has a high affinity for FcRI and has weak affinity for all other receptors; thus, it represents the dominant antibody subclass following repeated or long-term exposure to an antigen in a non-infectious setting or in immune responses to therapeutic proteins [20]. Due to the distinct functions of different IgG subclasses, we considered it necessary to further characterize the subclass-specific IgG N-glycome profile in HD patients.
In this study, we performed a comparative study by mapping the immunological profile and N-glycome at different levels, with the aim of revealing the pathogenic mechanism of HD caused by crayfish and providing a potential marker for HD detection or monitoring. For the global profiling of potential serological indicators in HD, the serum N-glycome from HD patients and normal individuals was analyzed by means of high-throughput matrix-assisted laser desorption ionization (MALDI) time-of-flight (TOF) mass spectrometry (MALDI-TOF-MS; AB SCIEX, Canada). Furthermore, the levels of five immunological proteins were measured using commercial assays. Considering the significant difference in IgG concentrations between healthy controls (HC) and HD, the IgG Nglycome—including the total IgG glycome and subclass-specific IgG glycosylation—was further investigated. This study reveals the strong correlation between HD and glycosylation changes, especially for IgG N-glycosylation, providing a novel insight into the etiology of this rare disease.
《2. Materials and methods》
2. Materials and methods
《2.1. Study populations》
2.1. Study populations
Samples were donated from the Wuhan Center for Disease Control & Prevention. The samples were collected from individuals who had developed symptoms of HD after eating crayfish. Simultaneously, we collected serum samples from healthy people whose age and sex matched those of the HD patients. The participants were aware of the follow-up experimental study and signed the relevant informed material. The study was carried out in accordance with the Helsinki Declaration of 1975, and all the experimental content was approved by the Professional Ethics Committee of Huazhong University of Science and Technology and the Wuhan Center for Disease Control & Prevention. Detailed sample information is listed in Table 1. Serological tests of five common markers for HD showed probably significant alterations in aspartate amino transferase (AST), alanine aminotransferase (ALT), CK, and lactate dehydrogenase (LDH).
《Table 1》
Table 1 Clinical characteristics of the demographic information in this study.

IQR: inter-quartile range; AST: aspartate amino transferase; ALT: alanine aminotransferase; LDH: lactate dehydrogenase; U: unit.
《2.2. Measurement of five immunological indicators》
2.2. Measurement of five immunological indicators
Human IgG, IgA, IgM, complement component 3 (C3), and complement component 5 (C5) quantitation kits were purchased from Roche Diagnostics (Indianapolis, USA). Serum concentrations of these immunological indicators, including IgG, IgA, IgM, C3, and C5, were analyzed using an immunoturbidimetric assay via an autoanalyzer (TBA-30FR; Toshiba, Japan) according to the manufacturer’s instructions.
《2.3. IgG purification and desalting》
2.3. IgG purification and desalting
A commercial Hitrap Protein G (GE Healthcare, USA) pre-packed column was used to isolate IgG from serum via affinity chromatography by means of an AKTA prime plus purifier system (GE Healthcare). In brief, serum samples (50 μL) were diluted with loading buffer and filtered through a syringe filter prior to injecting into the column. Subsequently, neutralizing buffer was added to the purified fractions to keep the IgG fractions stable. Next, the protein solution was desalted using a desalting column (GE Healthcare) and then lyophilized under a vacuum. It should be noted that, in order to prevent a batch effect from being generated during the batch processing, all samples were randomly selected. The abundance of each sample was obtained throughout the process via a detector. In addition, the purity of the collected fractions was elucidated by means of sodium dodecyl sulfate polyacrylamide gel electrophoresis (SDS-PAGE).
《2.4. N-glycan release and derivatization》
2.4. N-glycan release and derivatization
N-glycans from human serum or serum-derived IgG were released by means of peptide-N-glycosidase F (PNGaseF) digestion using Protein Deglycosylation Mix II (New England Biolabs, USA), followed by separation and purification of the glycans through solid-phase extraction (SPE) as described previously [21]. In brief, 10 μL of serum and IgG fractions were dissolved in ultra-purified water to reach a volume of 94 μL. An additional 3.6 μL of PNGaseF buffer and 2.4 μL of denaturing buffer were sequentially added to the mixture. After the mixture was denatured in a Thermo-Shaker (Ningbo Hinotek Technology Co., Ltd., China) and cooled to room temperature, 12 μL of Nonidet P-40 (NP-40) was added, followed by the addition of 5 units of PNGaseF. After incubation at 37 °C overnight, the glycans were captured by means of porous graphitized carbon (PGC)-based (Sigma-Aldrich, USA) SPE and were then further concentrated under a vacuum concentrator (Eppendorf, Germany). To avoid the loss of sialic acid during the MALDI-TOFMS test, the glycans were derivatized with methylamidation according to our previous study [22]. In brief, the sample was dissolved in 25 μL of dimethyl sulfoxide (DMSO; Sigma-Aldrich) containing 1 mol·L–1 methylamine hydrochloride and 0.5 mol·L–1 N-methylmorpholine, followed by the addition of 25 μL of DMSO containing 50 mmol·L–1 (7-azabenzotriazol-1-yloxy)tris-pyrrolidino-phosphonium hexa-fluorophosphate (PyAOP; SigmaAldrich). The mixture was incubated at room temperature for 30 min. Then, the derivatized glycans were purified through microcrystalline cellulose (MCC)-based (Sigma-Aldrich) SPE following procedures in the previous literature [23].
《2.5. IgG glycopeptides enrichment》
2.5. IgG glycopeptides enrichment
Based on the methods in our recent report [24], IgG glycopeptides were obtained by tryptic digestion followed by glycopeptide enrichment via MCC-based SPE. The dried IgG was dissolved in 100 lL of freshly made 50 mmol·L–1 ammonium bicarbonate and was then denatured in Thermo-Shaker. Following the addition of trypsin to the enzyme with a ratio of 1:50, the mixture was incubated at 37 °C overnight. Before loading the samples to the MCC cartridge, the SPE tubes (BonnaAgela Technologies Inc., China) were pre-washed with 3 mL of ultra-pure water (Rephile Bioscience, USA) and equilibrated with the same volume of 80% acetonitrile (ACN; Merck KGaA, Germany) containing 0.1% trifluoroacetic acid (TFA; Sigma-Aldrich). The glycopeptides were eluted with 1 mL of ultra-pure water and concentrated by evaporation; they were then stored at –20 °C until use.
《2.6. MALDI-TOF-MS analysis》
2.6. MALDI-TOF-MS analysis
After the serum and IgG-derived N-glycans were purified by means of SPE, the glycome spectrum of each sample was analyzed using 5800 MALDI-TOF-MS. Except for the mass-to-charge ratio (m/z), a similar scheme was conducted as described previously [21]. In brief, the sample was dissolved in 50% ACN, one tenth of which was added to the MALDI plate. After air drying, an equal amount of 10 mg·mL–1 2,5-dihydroxybenzoic acid (SigmaAldrich) containing 50 mmol·L–1 sodium acetate (Sigma-Aldrich) was added to the sample. The range of m/z was set at 1000–3000 and 1000–4500 for IgG and serum N-glycans, respectively. A total of 1000 laser shots were applied to each sample spot. The data were acquired in the positive ion reflector mode using a 5800 MALDI-TOF-MS (AB Sciex). To overcome the batch effect, all samples were randomly spotted onto the plate in triplicate. Glycan structures were assigned with the aid of the glycobioinformatics tool GlycoMod and the published literature [25–27]. The N-glycan structures were also confirmed by PGC combined with nanoflow liquid chromatography (nano-LC)-electrospray ionization (ESI)-tandem mass spectrometry (PGC-nano-LC-ESI-MS/MS) [21,22]. All the glycan structures were visualized using GlycoWorkBench 2.1 software.
《2.7. Nano-LC-ESI-MS/MS analysis》
2.7. Nano-LC-ESI-MS/MS analysis
Considering the importance of the glycoproteomic analysis of IgG in disease [28], liquid chromatography-mass spectrometry (LC-MS) was further used to analyze the subclass-specific IgG glycosylation in HD. To avoid the batch effect, all clinical samples were randomly injected in triplicate. Detailed information about the glycopeptide analysis is described in a previous study [24]. Separation was achieved on a NanoLC Ultra System (Agilent Technologies, USA) using a trap column (Beijing Proteomics Front, China) and analytical column (Beijing Proteomics Front), with C18 as the stationary phase. The glycopeptides were eluted with a linear gradient of 5% ACN/0.1% TFA in water (Buffer A) and 5% water/0.1% TFA in ACN (Buffer B) at a flow rate of 2.0 and 0.3 μL·min–1 for the loading pump and gradient pump, respectively. EIS-mass spectrometry (ESI-MS) and collision-induced dissociation tandem mass spectrometry (CID MS/MS) analysis were performed in the positive ion and high-sensitivity mode with a triple TOF 5600 system (AB Sciex). MS data were collected in information dependent acquisition (IDA) mode.
《2.8. Data processing and statistics》
2.8. Data processing and statistics
The mass spectrometry raw glycomics data have been deposited to the ProteomeXchange Consortium via the PRIDE partner repository with the dataset identifier PXD033345. The data from MALDI-TOF-MS and LC-MS were preprocessed via Data Explorer and PeakView software, respectively, and exported with txt forms. With the self-developed code in matrix laboratory (MATLAB) solution, all exported MS data can be processed automatically and rapidly, as well as being integrated for subsequent statistical analysis. The MALDI-TOF-MS data were processed by Mass Master [29], and the LC-MS data were processed by AreaProportion_Simple [24]. The significant difference in the serum IgG concentration and glycan profile between the HC and HD patients was examined using the Mann–Whitney U test. False discovery rate (FDR) was controlled using the Benjamini–Hochberg procedure with the FDR set to 0.05 [30], and an adjusted P value of less than 0.05 was considered to be significantly different. Subsequently, for the significantly different variables, a receiver operating characteristic (ROC) analysis was performed to evaluate the diagnostic performance. Through orthogonal projections to latent structures discriminant analysis (OPLS-DA), we also tested the contribution rate of different types of glycosylation to the development of HD. The Mann–Whitney U test and ROC analysis were conducted using GraphPad Prism 8; OPLS-DA was performed via SIMCA 13.0.
《3. Results 》
3. Results
《3.1. Serological test of five immunological indicators》
3.1. Serological test of five immunological indicators
We observed that all the immunological indicators were decreased in HD patients compared with HC (Fig. 1(a)), especially C3, IgG, and IgM, suggesting inhibition of the humoral immune system in HD. The ROC analysis showed that the IgG concentration had a moderately accurate area under the curve (AUC) score of 0.71 for differentiating HD from HC, with a sensitivity of 60.5% and a specificity of 72.0% (Fig. 1(b)), demonstrating the great importance of IgG concentration in this disease.
《Fig. 1》

Fig. 1. Evaluation of serological criteria for the differentiation of HD patients from HC. (a) Scatter plot of the serum levels of five immunological indicators in HC and HD; (b) diagnostic performance of those indicators for the diagnosis of HD patients. The Mann–Whitney U test followed by Benjamini–Hochberg multiple tests correction were performed, with *P < 0.05 and ***P < 0.005. NS: no significance.
《3.2. Characterization of the N-glycome profile from serum and IgG》
3.2. Characterization of the N-glycome profile from serum and IgG
The schematic workflow of the glycome study is illustrated in Fig. 2. IgG was isolated from the serum of HC and HD using a Protein G column by means of affinity chromatography (Figs. S1(a)–(c) in Appendix A) and desalted using a size exclusion chromatograph (Figs. S1(d) in Appendix A). The purity of the IgG fractions was elucidated by SDS-PAGE (Fig. S1(e) in Appendix A). To prevent the loss of sialic acid contained in the sialylated glycans during the analysis of MALDI-TOF-MS, methylamidation of the carboxyl group was first performed. To evaluate the repeatability and robustness of this method, quality control was conducted interday and intraday by randomly analyzing three normal serum samples, revealing the coefficient variances (CVs) of the six major N-glycans to be less than 20% (Fig. S2 in Appendix A). The representative MALDI-TOFMS spectra or base peak chromatograms (BPCs) of normal and HD patients are presented in Fig. 3. We identified a total of 55 serum glycans, including 54 N-glycans listed in Table S1 in Appendix A and one unusual sialylated glycan (H3N3S1). The results are consistent with Refs. [10,25,31], covering all the typical glycan features including high-mannose, complex-, and hybrid-type compositions. In addition, 28 IgG N-glycans (Table S2 in Appendix A) and 47 IgG glycopeptides (Table S3 in Appendix A) were identified as described previously [21,24]. The glycan-derived traits were calculated by grouping together the compositions with similar glycan structures (Tables S4–S6 in Appendix A), including high mannosylation (Man), bisecting N-acetylglucosamine (B), fucosylation (F), galactosylation (G), and sialylation (S).
《Fig. 2》
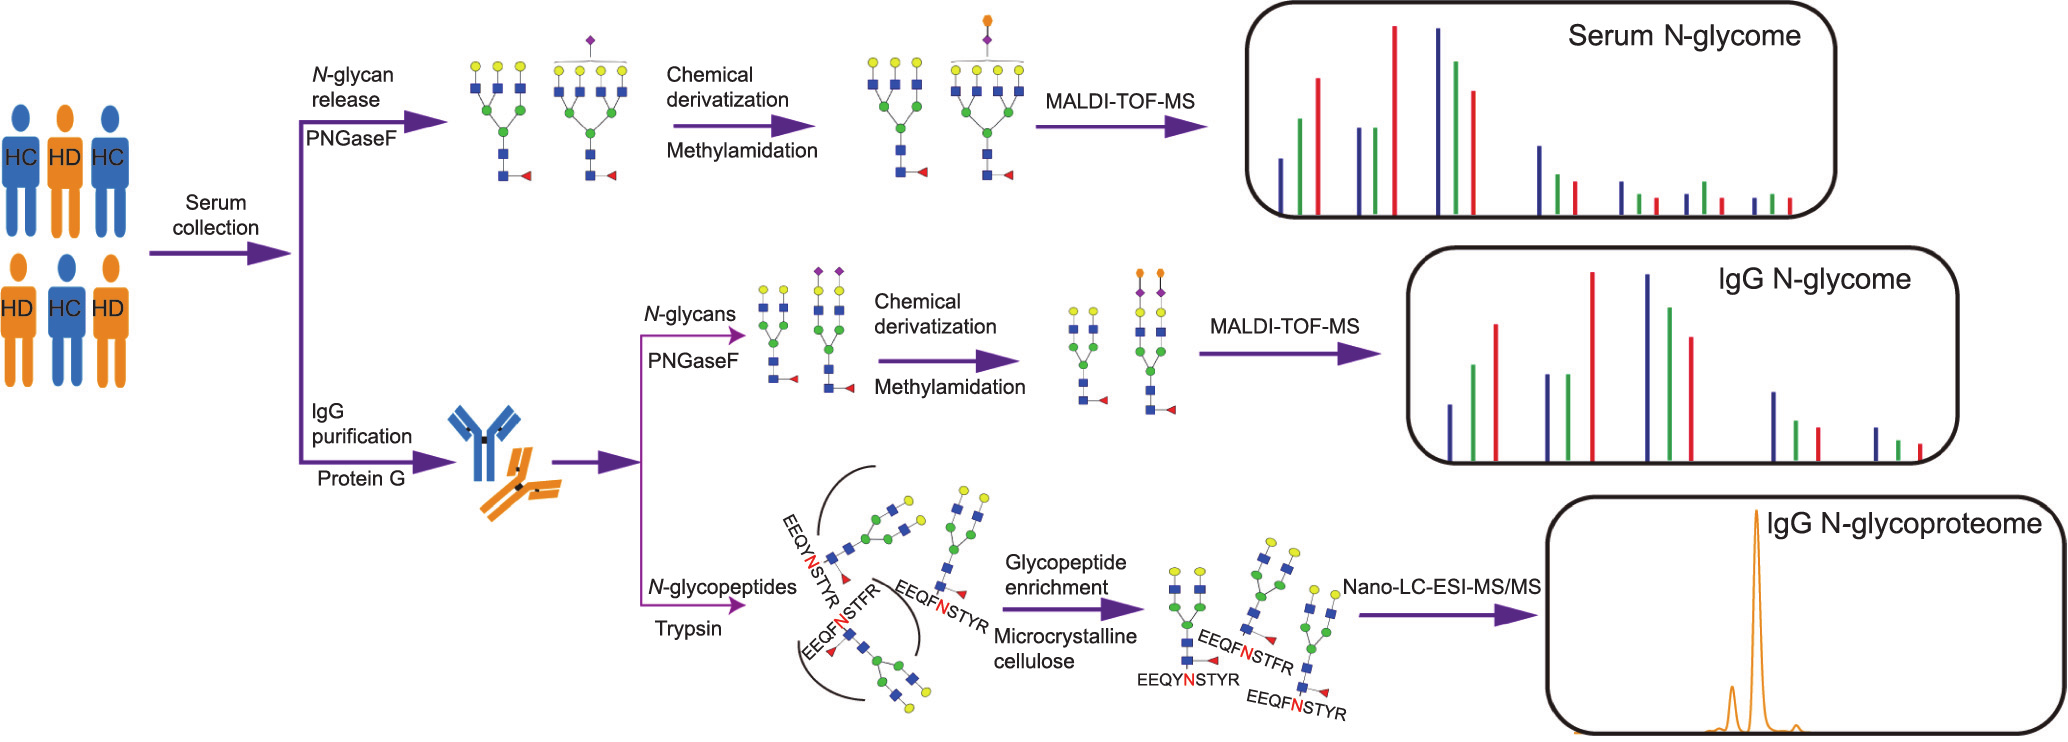
Fig. 2. Schematic workflow of the comprehensive profiling of serum and the IgG N-glycome in HC and individuals with HD. Samples from HC or HD were randomly selected for the N-glycome in the same manner. Serum was directly processed following the MALDI-TOF-MS N-glycan analysis. IgG was initially isolated from serum using a Protein G column, followed by N-glycans analysis via MALDI-TOF-MS or subclass-specific glycans analysis by means of nano-LC-ESI-MS/MS. Blue square: N-acetylglucosamine; green circle: mannose; yellow circle: galactose; purple diamond: sialic acid; red triangle: fucose. EEQYNSTYR: IgG1; EEQFNSTFR: IgG2; EEQFNSTYR: IgG3/4.
《Fig. 3》

Fig. 3. Representative N-glycome profile of serum, IgG, and subclass-specific IgG from HC and individuals with HD. (a) Representative MALDI-TOF-MS spectra of serum Nglycans from HC and HD; (b) representative MALDI-TOF-MS spectra of IgG N-glycans from HC and HD; (c) representative nano-LC-ESI-MS/MS BPC of subclass-specific IgG N-glycans in HC or HD.
《3.3. Association between serum N-glycosylation and the development of HD》
3.3. Association between serum N-glycosylation and the development of HD
We analyzed the differential glycosylation in HD patients from two perspectives: glycan features and individual glycan. In terms of glycan features, statistical analysis showed that two different types of serum N-glycosylation changed significantly in HD patients (Fig. 4(a) and Table S7 in Appendix A). More specifically, total fucosylation (F total) and mono-galactosylation (G1) were obviously increased in the disease compared with the HC. Further analysis revealed the uninformatic value (AUC < 0.70) of these two glycosylation types for the prediction of HD, although their AUC scores were close to being sufficient for diagnosis (Fig. 4 (b)). To explore potential glycan indicators for this disease, we analyzed the individual glycan profile in HD, and found that none of the N-glycans were significantly different between HD and HC. However, the differential expression in HD patients of the glycan compositions of H3N3S1, H4N5F1, and H5N4S2 indicate that these may play an important role in HD progression (Table S8 and Fig. S3 in Appendix A), warranting further investigation into the serum Nglycome in HD cohorts.
《Fig. 4》

Fig. 4. Glycosylation level of the serum N-glycome in HC and HD. Each scatter represents the individual sample. The Mann–Whitney U test followed by Benjamini–Hochberg multiple tests correction were performed, with *P < 0.05. F total: total fucosylation; G1: mono-galactosylation.
《3.4. IgG N-glycome in HD》
3.4. IgG N-glycome in HD
As shown in Fig. 5(a) and Fig. S4 in Appendix A, neutral bisection (B neutral) was significantly increased in HD, while there was a slight difference in sialylated bisection or total bisection between HC and HD. In addition, IgG total agalactosylation (G0 total) was markedly increased in HD, while galactosylation was decreased. IgG sialylation was decreased in HD compared with the HC, especially for total mono-sialylation (S1 total). Further ROC analysis showed moderately accurate AUC scores for B neutral, G0 total, and S1 total (Fig. 5(b)). These findings may be reflected by further analysis of individual IgG N-glycans (Table S9 in Appendix A), showing significantly changed neutral bisected N-glycans, agalactosylated N-glycans, and mono-sialylated N-glycans in HD.
《Fig. 5》

Fig. 5. Glycosylation level of the IgG N-glycome in HC and HD. (a) Box plot of three significantly changed IgG glycan features with the comparison between HC and HD; (b) diagnostic performance of N-glycan compositions for HD. The Mann–Whitney U test followed by Benjamini–Hochberg multiple tests correction were performed, with ***P < 0.005. B neutral: neutral bisection; G0 total: total agalactosylation; S1 total: total mono-sialylation.
《3.5. Subclass-specific IgG glycosylation in HD》
3.5. Subclass-specific IgG glycosylation in HD
We classified the structures of IgG glycopeptides in different subclasses and calculated the change in different glycosylation in HD (Table 2). Sialylation (S) of IgG1 was distinctly increased in HD. Moreover, sialylation per antenna on diantennary glycans (A2S) was also significantly increased in the patients, demonstrating the importance of sialylation in the disease pathogenesis. Concurrently, we observed that sialylation (S) of IgG1 was markedly increased in HD. In addition, sialylation (S) of IgG2 was markedly increased in HD, particularly for sialylation per galactose on diantennary glycans (A2GS), indicating that the changes in sialic acid were independent of the effect of galactose. Because sialylation (S) of the total IgG N-glycome showed a gentle decrease in HD patients compared with the HC, we consider that this change may be subclass-specific. Total monogalactosylated glycans (G1 total) and total agalactosylated glycans (G0 total) of IgG3/4 were significantly increased and decreased in HD, respectively. In addition, biantennary fucosylated galactosylation (A2FG) of IgG3/4 showed overexpression, suggesting a strong correlation between IgG galactosylation and HD.
《Table 2》
Table 2 Relative intensity of subclass-specific derived traits of IgG N-glycans in the comparison between HC and HD patients.

Padj: adjusted P value; SD: standard deviation; CI: confidence interval; G0: agalactosylated glycans; G1: monogalactosylated glycans; G2: digalactosylated glycans; A2G: galactosylation per antenna on diantennary glycans; A2S: sialylation per antenna on diantennary glycans; A2GS: sialylation per galactose on diantennary glycans; A2FG: biantennary fucosylated galactosylation; A2FB: bisection of fucosylated diantennary glycans; A2FS: sialylation per antenna on fucosylated diantennary glycans; A2FGS: sialylation per galactose on fucosylated diantennary glycans. Significant difference is in bold.
《3.6. Correlation between levels of serological markers and Nglycosylation levels》
3.6. Correlation between levels of serological markers and Nglycosylation levels
Notably, we observed that the alterations in the levels of AST and ALT were strongly correlated with the glycosylation changes of subclass-specific IgG N-glycosylation (Table 3 and Fig. S5 in Appendix A). More specifically, sialylation (S) of IgG2 was positively correlated with AST (r = 0.72, P = 0.0439). Galactosylation per antenna on diantennary glycans (A2G, r = 0.80, P = 0.0314) and digalactosylation (G2, r = 0.81, P = 0.0275) of IgG2 were positively correlated with ALT, while agalactosylation (G0) of IgG2 was negatively correlated with ALT (r = –0.78, P = 0.0396). In addition, the G2 (r = 0.89, P = 0.0079) and A2FG (r = 0.90, P = 0.0051) of IgG3/4 were positively correlated with ALT.
《Table 3》
Table 3 Pearson correlation of IgG glycosylation with common serological markers for HD.


F neutral: neutral fucosylation; F sialo: sialylated fucosylation; F total: total fucosylation; B neutral: neutral bisection; B sialo: sialylated bisection; B total: total bisection; G0 total: total agalactosylation; G1 total: total monogalactosylation; G2 total: total digalactosylation; S total: total sialylation; S1 total: total mono-sialylation; S2 total: total disialylation. r: correlation coefficient; R2: regression square. Significant difference is in bold.
《4. Discussion》
4. Discussion
In this study, the underlying mechanism of HD was deciphered at the N-glycome level for the first time. Moreover, the full immunological profile of HD was characterized by measuring five immune proteins in serum. As the most abundant glycoprotein in serum, IgG was found to be significantly changed in HD and possibly serves as a marker for disease progression. Given the crucial role of IgG in adaptive immunology, our data may demonstrate the immune responses in HD development. Importantly, the effector functions of IgG are different in different subclasses and are regulated by the attached glycans [32], warranting the investigation of the IgG N-glycome in this disease. Glycans are involved in almost all fundamental molecular and cellular processes in diseases, so revealing the full aspects of the glycome could improve our understanding of pathogenesis [33]. Therefore, we sought to decipher the potential etiology of HD by characterizing the Nglycome profile in serum, serum-derived IgG, and subclassspecific IgG.
It has been reported that HD is caused by an unknown heatstable toxin whose invasion leads to a sharp increase in CK [34,35]. Thus, a significant increase in CK has been listed as the criterion for the diagnosis and detection of HD in clinics and laboratory [36], even though little is known about other molecular changes in HD patients at the serum level. A recent study used liver function tests to demonstrate that particular enzymes were also increased in HD patients [37], suggesting a difference between HD and gastroenterology diseases. In addition to the digestive system response, immune responses against food antigens associated with noxious substrates play an important role in the development of diseases [38]. In this work, we attempted to explore the full immunological profile of HD and to determine whether these changes of immunological indicators could be used as other criteria for the detection of HD. Our data showed decreased C3 and C4 in HD patients, which aligned with the observation that young athletic men exhibited a lower level of C3 and C4 [39]. Due to the contribution of intense exercise to HD, additional research on exerciseinduced HD may assist in revealing the disease-specific molecular mechanism. Indeed, the results suggest that complement system activation is involved in crayfish-induced HD. Uniform decreases in the levels of IgA, IgM, and IgG in HD patients compared with HC suggest that immunoglobulins from immune niches are inhibited during HD progression. This result is, to some extent, consistent with a previous report that aerobic exercise triggered the de novo synthesis of immunoglobulins [40], indicating a negative impact of HD on the immune system. According to a report that a reduction or absence of IgG predisposes individuals to recurring infections [41], we presumed a similar molecular mechanism in infectious disease. Importantly, it has been reported that the serum IgG concentration was lower in patients with rheumatoid arthritis (RA) compared with HC [42], indicating a possible similarity between HD and autoimmune disease. This is the first evidence showing the humoral immune feature of patients with HD and indicating that the levels of IgG may be complementary to clinical criteria for HD diagnosis.
Initially, our data showed that the fucosylation and galactosylation of serum were elevated in HD; however, the resulting score lacked information that could be used to distinguish HD patients from controls. In addition, it was unclear which protein glycosylation changed or what metabolic product was secreted, due to the complexity of the total serum, which suggested that priority should be given to the IgG N-glycome analysis in this disease. Notably, our previous study demonstrated that environmental toxins probably lead to an immune response and are involved in physiological activities, resulting in altered IgG glycosylation [43]. Considering the great impact of glycosylation on IgG effector functions in immune responses, we performed a comprehensive study on the IgG glycome in HD. It was found that increased bisection and agalactosylation and decreased sialylation of IgG were strongly associated with HD and could be used to obtain at least a moderately accurate diagnosis for HD. Depending on the extent of glycosylation, IgG glycosylation could activate ADCC or promote inflammatory activity [44,45], demonstrating potential processes in the development of HD. In particular, IgG sialylation binds to the carbohydrate area of dendritic cell-specific intercellular adhesion molecule-3 grabbing non-integrin (DC-SIGN), subsequently activating the antibody-mediated anti-inflammatory signaling pathway [46]. Due to the activation of ADCC or the complementdependent cytotoxicity (CDC) activities and anti-inflammatory effect caused by up-regulated IgG sialylation in the disease progression [47], we consider HD to be associated with IgGmediated inflammation or a complement-mediated immune response. Similarly, decreased core fucosylation of IgG significantly improved its affinity to Fc RIIIA and reduced ADCC activity [48]. In parallel, IgG agalactosylation was significantly increased while galactosylation was decreased in HD, which was in agreement with inflammatory diseases, autoimmune diseases, and cancers [49]. Although increased neutral bisection has been observed in disease patients, the impact of bisecting GlcNAc on ADCC activity was attributed to the steric hindrance of core fucose [50]. Hence, further studies on the role of IgG bisection in HD progression are significant. Overall, these results indicate an association between aberrant IgG glycosylation and the development of HD, suggesting that HD is associated with proinflammatory effects.
The functional significance of IgG glycosylation in diseases is impacted by subclass-specific changes, as demonstrated in different models [51]. Obtaining an in-depth understanding of the landscape of subclass-specific IgG glycosylation in health and disease may provide critical new insights into disease pathogenesis and disease-specific stratification [52]. Herein, we explored the glycan profiling of different IgG subclasses in controls and HD patients. Interestingly, it was found that sialylation of IgG1 and IgG2 was up-regulated in HD, which is contrast to the changes in the total IgG N-glycome. These results may indicate a differential function between the total IgG glycome and subclass-specific IgG Nglycosylation in HD. However, the agalactosylation and monogalactosylation of IgG3/4 were significantly decreased and increased in HD, respectively, which was opposite to the trend in the total IgG N-glycome, suggesting that the change in IgG galactosylation may be subclass-specific. Therefore, we noted that the subclass-specific glycosylation profile was superior in revealing the underlying mechanism behind the disease.
The clinical characteristics of the subjects in this study showed a substantial increase in AST and ALT, significantly impacting liver function. Considering the strong association between abnormal liver function and glycosylation changes [52], it is anticipated that this change may result in alteration of the glycome profile. Indeed, we observed that the galactosylation and sialylation of IgG2 or IgG3/4 were strongly correlated with the serum levels of AST or ALT, two common indicators for HD. Due to the great impact of IgG sialylation or galactosylation on inflammatory activities, our findings indicate the molecular events of inflammation in HD. These findings may bridge the gap between IgG glycosylation changes and HD progression, warranting further investigation of the regulation mechanism of glycosylation in this rare disease.
Integrating our observations with the biological functions of IgG subclasses, we propose a possible pathogenic mechanism of HD. Upon the consumption of boiled crayfish, an unexplained toxin enters the body, and its chemical composition induces a secondary immune reaction into preferential patterns of class switching. Triggered by the antigens contained in the toxin, B-cells go through antibody class switching, particularly for IgG. Given the significantly decreased IgG protein level in HD patients, which is likely to be hypogammaglobulinemia, it is speculated that IgG1 comprises the predominant contribution to the total IgG level, as IgG1 is the most abundant subclass. Down-regulated IgG1 is involved in the inflammatory signaling pathway through sialylation-mediated ADCC. Similarly, as IgG2 is the second most abundant subclass, IgG2 deficiency leads to increased susceptibility to the pathogen, which is also modulated by dysregulated sialylation. Lower levels of IgG3/4 are accompanied by antibody responses to the antigen, resulting in a reduction of effector functions modulated by differential galactosylation. The shorter halflife of IgG3 and the relatively short-term exposure to the toxin may compromise the anti-inflammatory activity of the up-regulated galactosylation of IgG. The crayfish-derived toxin activates the humoral immune reaction, inducing IgG-subclass deficiency-mediated inflammatory activities modulated by the differential sialylation of IgG1/2 and galactosylation of IgG3/4.
In conclusion, this study indicates that the IgG N-glycome displays higher diagnostic merit than the total serum N-glycome for discriminating between HD patients and HC. The glycan features of IgG core fucosylation, galactosylation, and sialylation were found to be strongly correlated with the clinical inflammatory markers and showed good diagnostic performance for HD. For the first time, the glycome profile of HD has been comprehensively characterized, improving our understanding of the etiology of this unexplained rare disease. Further larger scale studies are needed to investigate the casual relationship between glycosylation changes and HD initiation, in order to reveal the underlying molecular mechanism of this disease.
《Acknowledgments》
Acknowledgments
We are grateful to acknowledge the financial support from the National Key Research and Development Program of China (2022YFC3400800), the National Natural Science Foundation of China (81827901), China Postdoctoral Science Foundation (2021M691144), Wuhan Special Preventive Medicine Research (MY19M01), and Hubei Province Key Special Preventive Program (WJ2019H303).
《Authors’ contribution》
Authors’ contribution
Si Liu, study concept and design, drafting of the manuscript, analysis and interpretation of data, statistical analysis; Yuanyuan Liu and Jiajing Lin, research performance and acquisition of data; Bi-Feng Liu, critical revision of the manuscript for important intellectual content, administrative support; Zhenyu He, administrative support, provision of study material or patients; Xiaomin Wu, study concept and design, administrative support, provision of study material or patients; Xin Liu, study concept and design, critical revision of the manuscript for important intellectual content, administrative support. All authors read and approved the final manuscript.
《Compliance with ethics guidelines》
Compliance with ethics guidelines
Si Liu, Yuanyuan Liu, Jiajing Lin, Bi-Feng Liu, Zhenyu He, Xiaomin Wu, and Xin Liu declare that they have no conflict of interest or financial conflicts.
《Appendix A. Supplementary material》
Appendix A. Supplementary material
Supplementary data to this article can be found online at https://doi.org/10.1016/j.eng.2022.09.012.


 京公网安备 11010502051620号